


This lesson examines polynomials and their graphs, as well as polynomial function applications. Students will:
- draw polynomial graphs based on the equations.
- apply polynomial functions to solve real-world problems.
- How are relationships expressed mathematically?
- How may data be arranged and portrayed to reveal the link between quantities?
- How are expressions, equations, and inequalities utilized to quantify, solve, model, and/or analyze mathematical problems?
- How can mathematics help us communicate more effectively?
- How may patterns be used to describe mathematical relationships?
- How can we utilize probability and data analysis to make predictions?
- How may detecting repetition or regularity help you solve problems more efficiently?
- How does the type of data effect the display method?
- How can mathematics help to measure, compare, depict, and model numbers?
- What factors determine whether a tool or method is appropriate for a specific task?
- How can we know whether a real-world scenario should be represented as a quadratic, polynomial, or exponential function?
- How would you explain the advantages of using multiple approaches to portray polynomial functions (tables, graphs, equations, and contextual situations)?
- Double root: Two distinct roots that are equal; this occurs in a quadratic function when the discriminant (b² – 4ac) is equal to zero.
- Degree: For a polynomial, the highest power of the variable in the polynomial.
- Local maximum: For a function, the greatest value of the range between a given interval of the domain.
- Local minimum: For a function, the least value of the range between a given interval of the domain.
- Multiplicity: For a polynomial with a factor \((x - a)^n\), the greatest value of n.
- Triple root: If \((x - a)^n\) is the highest power of (x – a), which is a factor of f(x), then a is a triple root when n = 3.
- poster paper
- markers
- copies of the Lesson 3 Exit Ticket (M-A2-3-3_Lesson 3 Exit Ticket and KEY)
- In the Lesson 3 Exit Ticket, students must provide a qualitative assessment of their comprehension of the relationship between the polynomial expression and its functional representation as a graph. The activity demands participants to indicate and identify the key characteristics of a polynomial function, such as its shape, roots, minimum, and maximum.
Active Engagement, Modeling, and Explicit Instruction
W: This lesson teaches students about the relationship between polynomial expressions and their graphical representations. Students will study and experience translating between polynomial function graphs and polynomial expressions, as well as problem-solving using polynomial functions.
H: Students are given a medical analogy comparing a fictional medicine to its bloodstream. Students will utilize their knowledge of medications as a model to explore the progression of medication throughout time.
E: The graph of the polynomial function x² − 4x + 4 shows students both algebraic notation and a two-dimensional representation. The apparent one-root solution, along with its two-form representation, provides students with a practical approach to connect with this abstract idea.
R: In Activity 5 (pairs and small groups), students create graphs of complicated polynomial functions to identify key ordered pairs, local minima, and maxima. Students must reconsider the relationship between polynomial terms and their behavior.
E: In Lesson 3 Exit Ticket, students were asked to identify significant graph components to demonstrate their mastery of polynomial functions. Students must demonstrate their understanding of the method by matching the unique roots of each polynomial.
T: Group and partner work are utilized to foster collaboration among students. The emphasis should be on explaining mathematical ideas using vocabulary phrases that are specific to the subject. Partnering exercises encourage students to reflect on their own grasp of the idea while also evaluating the representations of other students. Student sharing of ideas and insights is an effective technique to boost learning without your assistance.
Logical/Sequential/Visual Learners: Some students may find it beneficial to see multiple written renditions of the distinct steps in synthetic division. When writing or pointing to terms and operations, use their proper names.
O: Students' interest is piqued by the opening discussion due to its relevance to their lives. They are interested in a discussion on drugs in math class. You can present more features of polynomial graphs and then have students practice their skills. Students have a better knowledge of polynomial graphs. Finally, the class explores the role of drugs in the bloodstream and their relationship to polynomials. The lesson concludes by asking students to consider other scenarios that could be depicted using polynomial functions.
After this lesson, students will understand what a polynomial's graph looks like before sketching it and without using a graphing calculator. They will understand that the degree of a polynomial not only indicates the number of roots but also dictates the graph's final behavior (whether it is increasing or decreasing). Students will also comprehend the principles of local minima and maxima, which they will apply to graph polynomials. Polynomial functions are used to simulate revenue, birthrates, manufacturing expenses, and medication in the bloodstream. Students grasp mathematical topics better when they realize how they relate to the actual world. Students will graph polynomial functions without the use of a graphing calculator. They will be able to extract information from polynomial models and apply it to create predictions.
Begin this lesson with a discussion about being sick and taking medicine. When medication enters the body, its presence gradually decreases. The rate at which a medicine decreases varies depending on the medication, its dosage, and the patient's physical state. Ask the following questions:
"How many of you have been sick before?"
"How many of you have taken medication to help you feel better?"
"How does medicine work?"
Activity 1: Graphing Elapsed Time
"With your partners, discuss what the graph would look like if you were to plot the quantity of medicine in the bloodstream (y-axis) against time (x-axis)." Give students about five minutes, then divide them into groups of four to present their opinions. Encourage them to sketch graphs. "Is this a line graph? A parabola? A cubic or quartic?" After another five minutes, hold a class discussion to see what the students are thinking. Don't reveal the graph yet, but inform them that today's lesson will demonstrate polynomial graph features and how polynomial functions can be utilized to model many real-world scenarios.
"What information about a polynomial's graph does its degree provide?" Students may claim that the degree indicates the number of roots, or x-intercepts, on the graph. You can then build a graph of a parabola with a vertex at (2,0), as illustrated, and pose the following questions:
"What degree polynomial does a parabola's graph illustrate?"
"How many x-intercepts should it have?"
"Why doesn't this graph have 2 x-intercepts?"
"Look at the parabola equation by adding the vertex into the graphing form of a parabola and writing it in both factored and standard form:
y = (x - 2)²
y = (x − 2)(x − 2)
y = x² − 4x + 4”
"What did we learn about factors and roots in the previous lesson?"
(If x - 2 is the factor, 2 is the root; in this case, 2 represents both roots.)
Display the following on the board for students to copy into their notebooks.
Example: y = (x - 2)²
y = (x − 2)(x − 2)
y = x² − 4x + 4
Multiplicity: This example demonstrates the multiplicity of roots. Because x − 2 appears twice as a factor, 2 is known as a double root.
When a root has an even multiplicity, the graph "bounces off" the x-axis (as illustrated above).
When a root has an odd multiplicity, the graph crosses the x-axis.
When listing the roots of a polynomial, specify the multiplicity of roots.
For example, the roots of y = \(x^3\) - 6x² + 12x - 8 are 2, 2, and 2 (triple root).
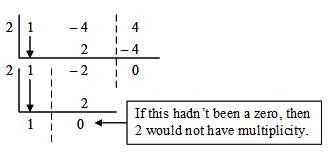
If the synthetic division is used to demonstrate that a number has multiplicity as a root, you can perform the division as many times as the multiplicity.
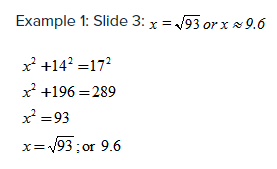
Consider the parabola that depicts y = x² - 4x + 4 from above.
Activity 2: Working on Polynomial Roots in Pairs
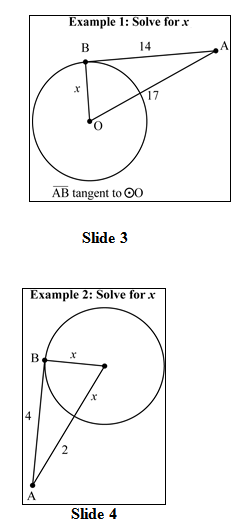
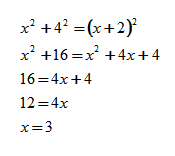
"In your pairs, respectively, one of you is A and the other is B." Give Student A the questions (a) and (c). Give Student B the questions (b) and (d).
a) \(x^3\) −3x² −9x − 5, roots − 1 and 5 (− 1 is a double root)
b) \(x^4\) − 12\(x^3\) + 48x² − 64x, roots 0 and 4 (4 is a triple root)
c) \(x^4\) + 2\(x^3\) − 11x² − 12x + 36, roots − 3 and 2 (− 3 and 2 are both double roots)
d) \(x^5\) − 2\(x^4\) + \(x^3\), roots 0 and 1 (0 is a triple root and 1 is a double root).
Students should note that the number of roots provided does not equal the degree of the polynomial. "Your task is to discover which root has multiplicity, or whether both roots do. Student A will read a polynomial to Student B and deliver the given roots. Student B must utilize synthetic division to determine whether the root has multiplicity, or if both do. When B is finished, A will verify his work, and you will switch roles. You will each read two polynomials to your partner."
“The degree of a polynomial determines more than just the number of its roots. Look at the board's parabolas (vertex at 0, 0).”
"Are you familiar with the equations of these two parabolas?"
(The first graph is y = x², while the second is y = -x².)
"What has changed between the first and second graphs?"
"What has changed between the first equation and the second?"
“Now, examine the graphs for the two cubic equations.”
"The first graph is y = \(x^3\), while the second graph is y = −\(x^3\). What are the similarities and differences between cubic graphs and parabolas?" Make sure someone describes how the negative symbol reflects (flips) the graph across the x-axis. Also, make sure there is a discussion of the graphs' "end behavior" (i.e., the parabola's ends go in the same direction, whereas the cubic graph's ends point in the opposite direction).
Students can add to their notes using the table below. "Remember that the leading coefficient is the number preceding the variable with the highest degree. For instance, in the polynomial 6\(x^5\) + 2\(x^4\) − \(x^3\) + 3x² + 4x − 7, the leading coefficient is 6."
"The degree determines the left end behavior, while the sign of the lead coefficient determines the right end behavior."
"Because polynomial graphs do not have an 'endpoint ,' there is no unique minimum or maximum, hence, polynomials are frequently described as 'local minima' or 'local maxima.' These spots show where the graph changes direction."
Put these definitions on the board so that students can add them to their notes.
Local Minima: are points where the graph transitions from decreasing to increasing.
Local Maxima: are points where the graph transitions from increasing to decreasing.
Activity 3: Plotting Minima and Maxima
Display the following table on the board and have students come up one or two at a time to fill it out.
Ask them to do this quietly. Remove any incorrect answers, but do not explain what they did wrong, so they may figure it out on their own. Tell them to overlook the last two columns for now.
Students should create graphs of polynomials with local minima and maxima from the table. They should first plot the minima and maxima, then investigate the end behavior, and last draw the graph. When they're finished, have them compare their work to another student's. They should discuss whether there are any differences between their graphs.
The final section of this lesson connects the new material to the opening activity. Display four separate graphs on the board: one linear, one quadratic, one cubic, and one quartic. In the opening medicine problem, ask students if they drew a form that resembled one of these four. Examine each graph in the medication context and determine which one makes the most sense to them now.
Activity 4: Determining End Behavior
Put the following problem on the board for students to solve: "Suppose a person takes an aspirin and then takes another five hours later." The polynomial equation represents the amount of medicine in the bloodstream: y = −.0108\(x^4\) + .316\(x^3\) − 3.0231\(x^2\) + 10.8668x − 5.3507, where x represents the time after taking the drug and y represents the amount of medication in the bloodstream in tenths of a percent. What is the end behavior of this polynomial? Use a calculator to graph the equation and answer the following questions: "
"For what values of x does the graph make sense? Why?"
[0.581 ≤ x ≤ 14.78; x numbers in the positive range].
"How much medication is in the bloodstream after one hour? After 13 hours?"
[2.798 and 10.8 units]
"At what point does the medicine work best?"
[Approximately 12 hr].
"When a person takes their second aspirin, what does the local minimum mean in terms of medication levels in the bloodstream?"
[Local maximum at 3 hr; maximum at 12 hr].
Activity 5: Graph Sketching in Pairs or Small Groups
"In pairs, sketch polynomial graphs with the given key points. When you're finished, collaborate with another pair to discuss the graphs. When everyone has finished, I will call on students to come to the front of the class and demonstrate an answer to one of the questions."
1. Roots at -4, -1, and 3, with a local maximum at (-3, 3), and a local minimum at (1, -3).
2. Roots at −1 (double) and 1 (double), with a local maximum at (0, 1) and local minima at (-1, 0) and (1, 0).
3. Roots at −5, −3, −1, 1, and 3, with local maxima at (−2, 4) and (2, 2) and local minima at (−4, −1) and (0, −2).
Use the Lesson 3 Exit Ticket (M-A2-3-3_Lesson 3 Exit Ticket and M-A2-3-3_Lesson 3 Exit Ticket KEY) to assess students' comprehension.
Extension:
Draw a graph of the polynomial function \(x^3\) - 9\(x^2\) + 20x and find the roots as well as the local minimum and maximum points. Determine whether the points are minimum or maximum. [roots: 0, 4, 5; local minimum between (4, 0) and (5, 0); local maximum between (1, 12) and (2, 12).]

Using Roots and Other Features to Graph (M-A2-3-3)
This lesson examines polynomials and their graphs, as well as polynomial function applications. Students will:
- draw polynomial graphs based on the equations.
- apply polynomial functions to solve real-world problems.
